Lesson 200

Lesson Objective: In this lesson, we will learn how to generate measures from our Mechanism analyses.

DEFINING MEASURES
In Mechanism, we can create realistic degree of freedom animations of our assemblies. That is a nice feature, but is not the most powerful feature we have. As we mentioned numerous times in the past, this tool is an analysis tool, used to simulate loads and forces on your assembly components as they are in motion.
We will now take the opportunity to learn how to get information out of the part that may be useful in our design efforts by gathering measures from our analyses. To define measures in mechanism mode, you first have to run an analysis on your assembly, and save your results playback file.
Once you have that, you can enter into the measures tool using the following icon in the feature toolbar.
![]()
EXAMPLE 1 – CAM FOLLOWER
We will continue with the cam follower assembly that we started in Lesson 18, called Spring_Example. If you recall, we added a spring and a damper to this assembly that already has a servo motor, several pin connections, a slider connection, and a cam follower.
We are going to create some measures to calculate forces, and also visually watch these measures on the animated assembly.
Run Analysis and Save Playback Results
The first thing we are going to do is re-run the dynamic analysis, just in case we forgot to save our playback results. Once you run the analysis (Cam_Rotate), go to the results tool, and click on the save icon to save your playback file (cam_rotate.pbk) to your working directory.
Create Measures
Now, we will close out of the results window, and click on
the Create Measures icon ( ![]() ). This will bring up the following
window.
). This will bring up the following
window.

At the top, there is a pull-down field with two options. These are:
· Measure vs. Time – Calculates the results as a function of analysis time.
· Measure vs. Measure – Calculates the results as a function of another result.
We will keep the default of Measure vs. Time, and move on to the next section. In the middle there is a large field that will list any measures defined for this assembly. Currently, we have no measures defined. To the left of this window are four icons. From top to bottom, these icons are:
· Create new measure
· Edit selected measure
· Copy selected measure
· Delete selected measure
Just below this field, is a check box used to graph the selected measures separately. We will see this a little later.
Finally, at the very bottom is a list of available result sets. There should be one for each analysis defined. We currently only have one available.
Measure 1 – Spring Load
The first measure we are going to create is the load from the spring as a function of time. Therefore, we are going to keep the option of Measure vs. Time, and then click on the Create new Measure icon. This will bring up the following window.

In the Name field, enter Spring_Load. For the type of the load, we have a variety of options to choose from. These are:
· Position – Measure the location of a point, vertex, or joint axis during the analysis.
· Velocity – Measure the velocity of a point, vertex or joint axis during the analysis.
· Acceleration – Measure the acceleration of a point, vertex or joint axis during the analysis.
· Connection Reaction – Measure the reaction forces and moments at joint, gear-pair, cam-follower, or slot-follower connections.
· Net Load – Measure the magnitude of a force load on a spring, damper, servo motor, force, torque or joint axis. You can also confirm the force load on a force motor.
· Loadcell Reaction – Measure the load on a loadcell lock during a force balance analysis.
· Impact – Determine whether impact occurred during an analysis at a joint limit, slot end, or between two cams.
· Impulse – Measure the change in momentum resulting from an impact event. You can measure impulses for joints with limits, for cam-follower connections with liftoff, or for slot-follower connections.
· System – Measure several quantities that describe the behavior of the entire system, including: Degrees of Freedom, Redundancies, Time, Kinetic Engergy, Linear Momentum, Angular Momentum, Total Mass, Center of Mass and Total Centroidal Inertia.
· Body – Measure several quantities that describe the behavior of a selected body, including: Orientation, Angular Velocity, Angular Acceleration, Mass, Weight, Center of Mass and Centroidal Inertia.
· Separation – Measure the separation distance, separation speed, and change in separation speed between two selected points.
· Cam – Measure the curvature, pressure angle, and slip velocity for either of the cams in a cam-follower connection.
· User Defined – Define a measure as a mathematical expression that includes measures, constants, arithmetical operations, and algebraic functions. You can use saved analysis features in this analysis as well – such as calculating the volume of liquid per time pushed from a syringe under a certain load, for example.
For our Spring_Load, we will use the Net Load option. Next, select the spring entity. The last step for this measure is to determine how the measurement will be taken. The pull-down at the bottom has the following options.
· Each Time Step – The measurement will be calculated for each time interval of the analysis, and the last time step measurement will be shown in the measure window.
· Maximum – Gives the maximum value for the measure over the entire analysis.
· Minimum – Gives the minimum value for the measure over the entire analysis.
· Integral – Graphs the integration of the function up to a given point in time.
· Average – Calculates the average value of the measure up to each time step of the analysis.
· Root Mean Square – Gives the root mean square value of the measure up to that point at a given time step.
· At Time – Gives the value of the measure at a specified time.
We are going to keep the Each Time Step option, and then our window will look like the following.

Click on OK and now you will see this measure listed in our main window, as shown in the next figure.

To view the graph, we must first select the measure (already selected in the figure above), followed by the result set, and then we will be able to select the graph icon in the upper left corner of our measure window. When we do this, we see the following graph.

From the graph, we can see that our spring starts out with a force of approximately 339N. This makes sense, because the “U” value that we specified was 60mm, but our spring was initially compressed about 4mm.
Then, as the spring is compressed, the force by the spring goes up to about 3513N at time 1.3sec. It then goes back to the original force when it extends again. This repeats, because our analysis goes through two complete revolutions.
Animate the Measure
Close out of the graph, and close out of the measure tool. We will return to this in a few minutes. Now, go to the results tool. Up to now, we have been playing back our animation, but we want to look at a different playback tool. On the main window, we can see three tabs. The third tab is entitled Display Arrows, and looks like the following.

We can see a list of defined measures (in this case just our Spring_Load). We will select this measure by placing a check in the box. Down in the bottom we will enter a value that will scale the arrow. 100% gives us a default arrow size that may disappear into the model. We will enter a value of 150 to make the arrows easier to see. NOTE: We are not actually changing the value of the force that is calculated, only making the arrows bigger.
Our window should look like the following when ready.

We should be able to see the arrows on the model at this time.

Now, click on the play button in the upper left corner of our results window, and you will be able to watch the arrows grow and shrink as the force increases/decreases over the analysis time.
Now, we are going to try a few more measures.
Piston_Velocity
Now, we are going to measure the velocity of the piston as it is being pushed up and down. To do this, return to the measures tool, create a new measure and call it Piston_Velocity.
For the type, select Velocity, and then pick the FOLLOW_PNT datum point on the model. At this time, our window looks like the following.
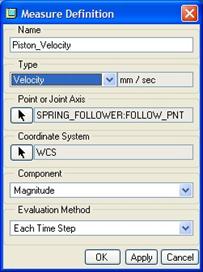
By default, it wants to use a world coordinate system (WCS), but we will turn on the display of coordinate systems, and click on the black arrow to re-select the ASM_DEF_CSYS coordinate system (which is behind the topmost CSYS in our model). Once we select this coordinate system, change the Component field to show the Y Magnitude, and leave the evaluation method at Each Time Step, as shown in the next figure.

At this time, we can also see an arrow on our model.

Click on OK, and then graph this measure alone. It looks like the following.

Close this graph window, and then select both measures from the list. Check the box to graph measures separately, and then click on the graph button. You will see a single window with both graphs in it as separate graphs, as shown in the next figure.

Close out of this, and uncheck the box to graph them separately. Click on the graph button again, and now both graphs appear in the same grid.

Based on the magnitude values, this may or may not be a useful graph to read. In this case, the magnitude for the Spring Force is much higher than the magnitude for the velocity, so the velocity graph becomes very flat.
Close out of this window, and play back your results with the velocity arrows present. Once you are done checking this out, go ahead and save and close your assembly.
LESSON SUMMARY
Measures are very useful for identifying the behavior of your moving assemblies. With the ability to visually watch the magnitude of your measures in the animation, you really get a sense for what is going on.
You can then use these measurements in design optimization, behavior modeling, etc. Because there are numerous measurement types, I highly recommend using the online help center for more information for specific measure types.
EXERCISE
Open up the Lock_Cam assembly that we worked on before, and play around with taking different measures for the different bits/springs. Animate your assembly with the arrows showing.
You will not need to save your assembly when done.